| |
| Hello Fellow ChartWatchers | I need your help this week. I'm recruiting you all as the official tiebreakers because I may or may not have lost a bet. Allow me to explain.
When we released the new "Symbol Summary" page back in January, I told my good friend Bill Shelby (the brains behind our Scan Engine) that it was hands down no question 100% the best new feature we'd roll out on StockCharts in 2020.
Admittedly, my claim was a bold one at the time considering we were scheduled for a summer release of StockChartsACP, our new interactive, full-screen Advanced Charting Platform. Of course, Bill told me I was wrong, said that ACP would easily upstage Symbol Summary, and promptly took the bet against me. It was a wise move looking back on it now. Hindsight really is "2020" (get it?!)
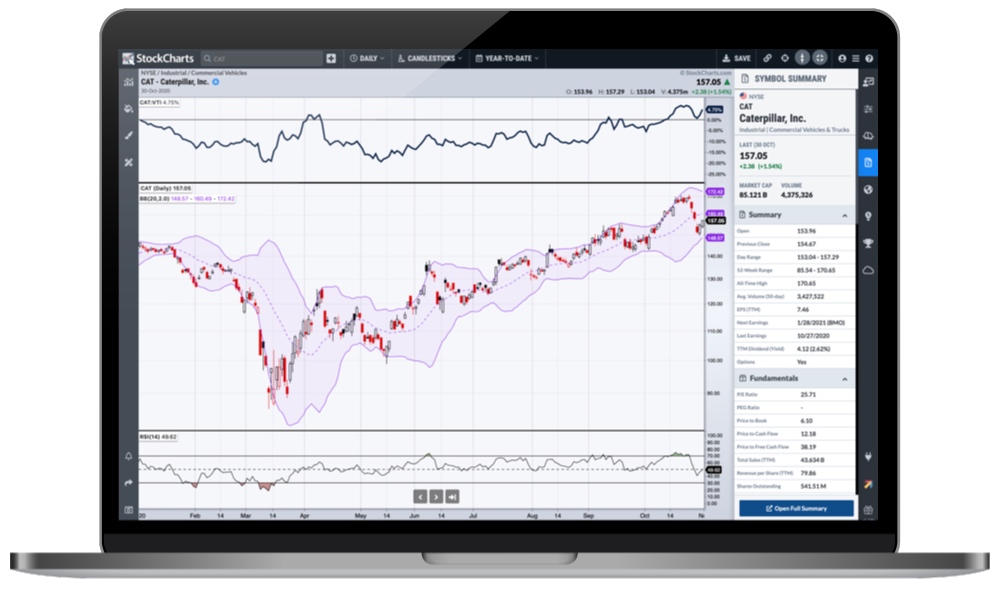
BUT – here's where things get interesting. Just yesterday, our ACP team launched a seriously cool new sidebar panel in StockChartsACP: "Symbol Summary".
Yep, that's right. We've taken all of the symbol-specific data you'll find on the normal Symbol Summary page and built it directly into ACP. This means that for any symbol you're charting in ACP, you can now open up the Symbol Summary panel on the righthand side to see after-hours prices, key fundamental figures, technical stats, earnings dates, dividend details, corporate information, SCTR rank and more - all in a concise layout conveniently displayed right next to your charts.

To see the magic for yourself, open up StockChartsACP and look for the icon on the right side of the screen that looks like a file with a dollar sign on it. Give it a click to open up the "Symbol Summary" panel and it will automatically load in data for whatever symbol you're charting. As you change the chart and switch from one symbol to the next, the Symbol Summary panel will follow along with you.
So what do you think? I won the bet, right? I told Bill that "Symbol Summary" is still the best new feature we've rolled out on StockCharts in 2020. Is it technically Symbol Summary within ACP? Sure. But hey, let's not get lost in the weeds here. It's time we chalk this one up as a win for yours truly! | | Chart on, my friends. | | | |
| THIS WEEK'S ARTICLES | | The Market Message | | Big Tech Stocks Weaken | | by John Murphy | | Four of the biggest tech stocks are weakening today after several of them reported decent earnings. And they're weighing on the rest of the market. Chart 1 shows Amazon.com (AMZN) falling to the lowest level in a month. Chart 2 shows Apple (AAPL) doing the same... | | | | | | | | | | | The Canadian Technician | | How Does This Resolve? | | by Greg Schnell | | One of the world's most difficult issues seems ready to explode. As the pandemic numbers soar in the second wave, the real problem is the size of the base that it is surging from. When the first wave hit, it multiplied from a small base... | | | | | | | DecisionPoint | | S&P 10: Lots of Toppy Charts | | by Erin Swenlin | | These are the ten stocks in the S&P 500 with the highest market capitalization, and they will have a significant effect on the movement of that market index... | | | | | | | | | | | MORE ARTICLES → | |
| | | "Wrap the Week" | David Keller, CMT (10.30.20) | | | | | | | Will the Markets Find Support? | Mary Ellen McGonagle | The MEM Edge (10.30.20) | | | | | | | Coming Up on StockCharts TV | Week of November 2nd | | | | | | | Volatility Soars As Market Takes Big Drop | Tom Bowley | Trading Places (10.29.20) | | | | | | | The Pitch | Mark Newton, CMT, John Kosar, CMT, Erin Swenlin with Grayson Roze (10.29.20) | | | | | | | UPCOMING GUESTS | | | | WATCH LIVE → | |
 | | Smarter Investing Starts Here. | | As a StockCharts Member, you unlock all of our most powerful tools and features, including saved charts and settings, custom scans, technical alerts and much more. Discover all that StockCharts can do with our free 1-month trial and start charting like a true market pro. | | | | Learn More | | |
| ChartSchool "Tip of the Week" | | You can find after-hours pricing for the pre- and post-market trading sessions on our "Symbol Summary" page. | | | VISIT CHARTSCHOOL → | |
| |
No comments:
Post a Comment