| Hello Fellow ChartWatchers | This week on "StockCharts In Focus", we took a look at how to find market-leading stocks using one of my personal favorite tools on StockCharts: "Sector Summary".
This unique research tool allows you to drill down through the S&P sectors into the industry groups and individual stocks within. As you'll see in the show, you can easily sort by different timeframes or performance metrics like the SCTR (StockCharts Technical Rank) to quickly pinpoint the market's true leaders. It's a fantastic resource for your higher-level market analysis, but also an effective source of top trade targets and promising new opportunities.
Click the video thumbnail below to watch now
Plus, don't forget – we're officially in the FINAL FEW DAYS of our year-end Holiday Special! Right now, you can save as much as $119.85 off our regular subscription prices with up to 3 FREE months of StockCharts service. So sign up for a new account or renew your membership today before the savings disappear!
Click Here to get started. | | Chart on, my friends. | | | |
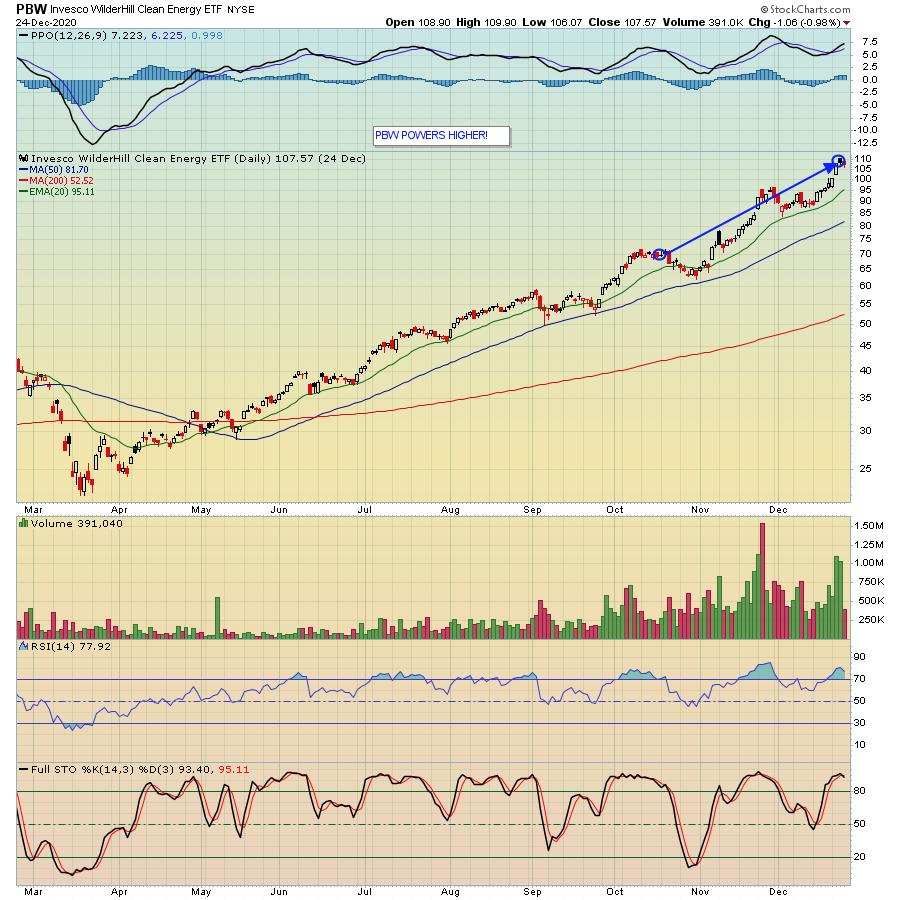
| THIS WEEK'S ARTICLES | | The Market Message | | Stock Uptrend Continues | | by John Murphy | | Tuesday's message used hourly bar charts to show the three major stock indexes holding short-term support levels. Wednesday's daily bars show stocks continuing to stay above their green 20-day moving averages. They're usually the first line of support on market pullbacks... | | | | | | | | | | | | | The Canadian Technician | | Which One Were You? | | by Greg Schnell | | This year created an extreme assortment of performance across financial advisors, hedge funds, individual investors, young entrepreneurs, self-directed investors and family office agencies. Those that protected capital might not have done as well if they didn't get back in early... | | | | | | | | | | | ChartWatchers | | This ETF Has Skyrocketed 58% in Just Two Months | | by John Hopkins | | A lot of traders opt for individual stocks when looking for outsized gains. But ETFs can produce great gains as well if you are able to identify which ones are poised to rise. As an example, take a look at the chart below on the Clean Energy ETF, PBW... | | | | | | | MORE ARTICLES → | |
| | | Top 10 Charts: Semiconductors | Andrew Thrasher, CMT | Reflections 2020 | | | | | | | Find Market-Leading Stocks With "Sector Summary" | Grayson Roze | StockCharts In Focus (12.23.20) | | | | | | | Top 10 Charts: March Drawdown | Ian McMillan, CMT | Reflections 2020 | | | | | | | Re-Evaluating Your Process | Gatis Roze, CMT, MBA | Reflections 2020 | | | | | | | Top 10 Charts: Food Commodities | Mish Schneider | Reflections 2020 | | | | | | | UPCOMING GUESTS | | | | WATCH LIVE → | |


No comments:
Post a Comment